business monitoring
Prometheus-based custom monitoring
Since the V5.3 version, Rainbond has added the custom business monitoring function, which supports users to realize the custom business monitoring based on Prometheus through the custom Exporter plug-in.This operation requires users to have a relatively systematic understanding of the Prometheus monitoring system.
MySQLD Exporter
As an example, Rainbond V5.3 comes with MySQLD Exporter plug-in after installation, which is based on the standard MySQLD Exporter implementation.The Prometheus monitoring system rbd-monitor that comes with Rainbond will collect the data in the Exporter and display it through the monitoring panel.
Plugin installation
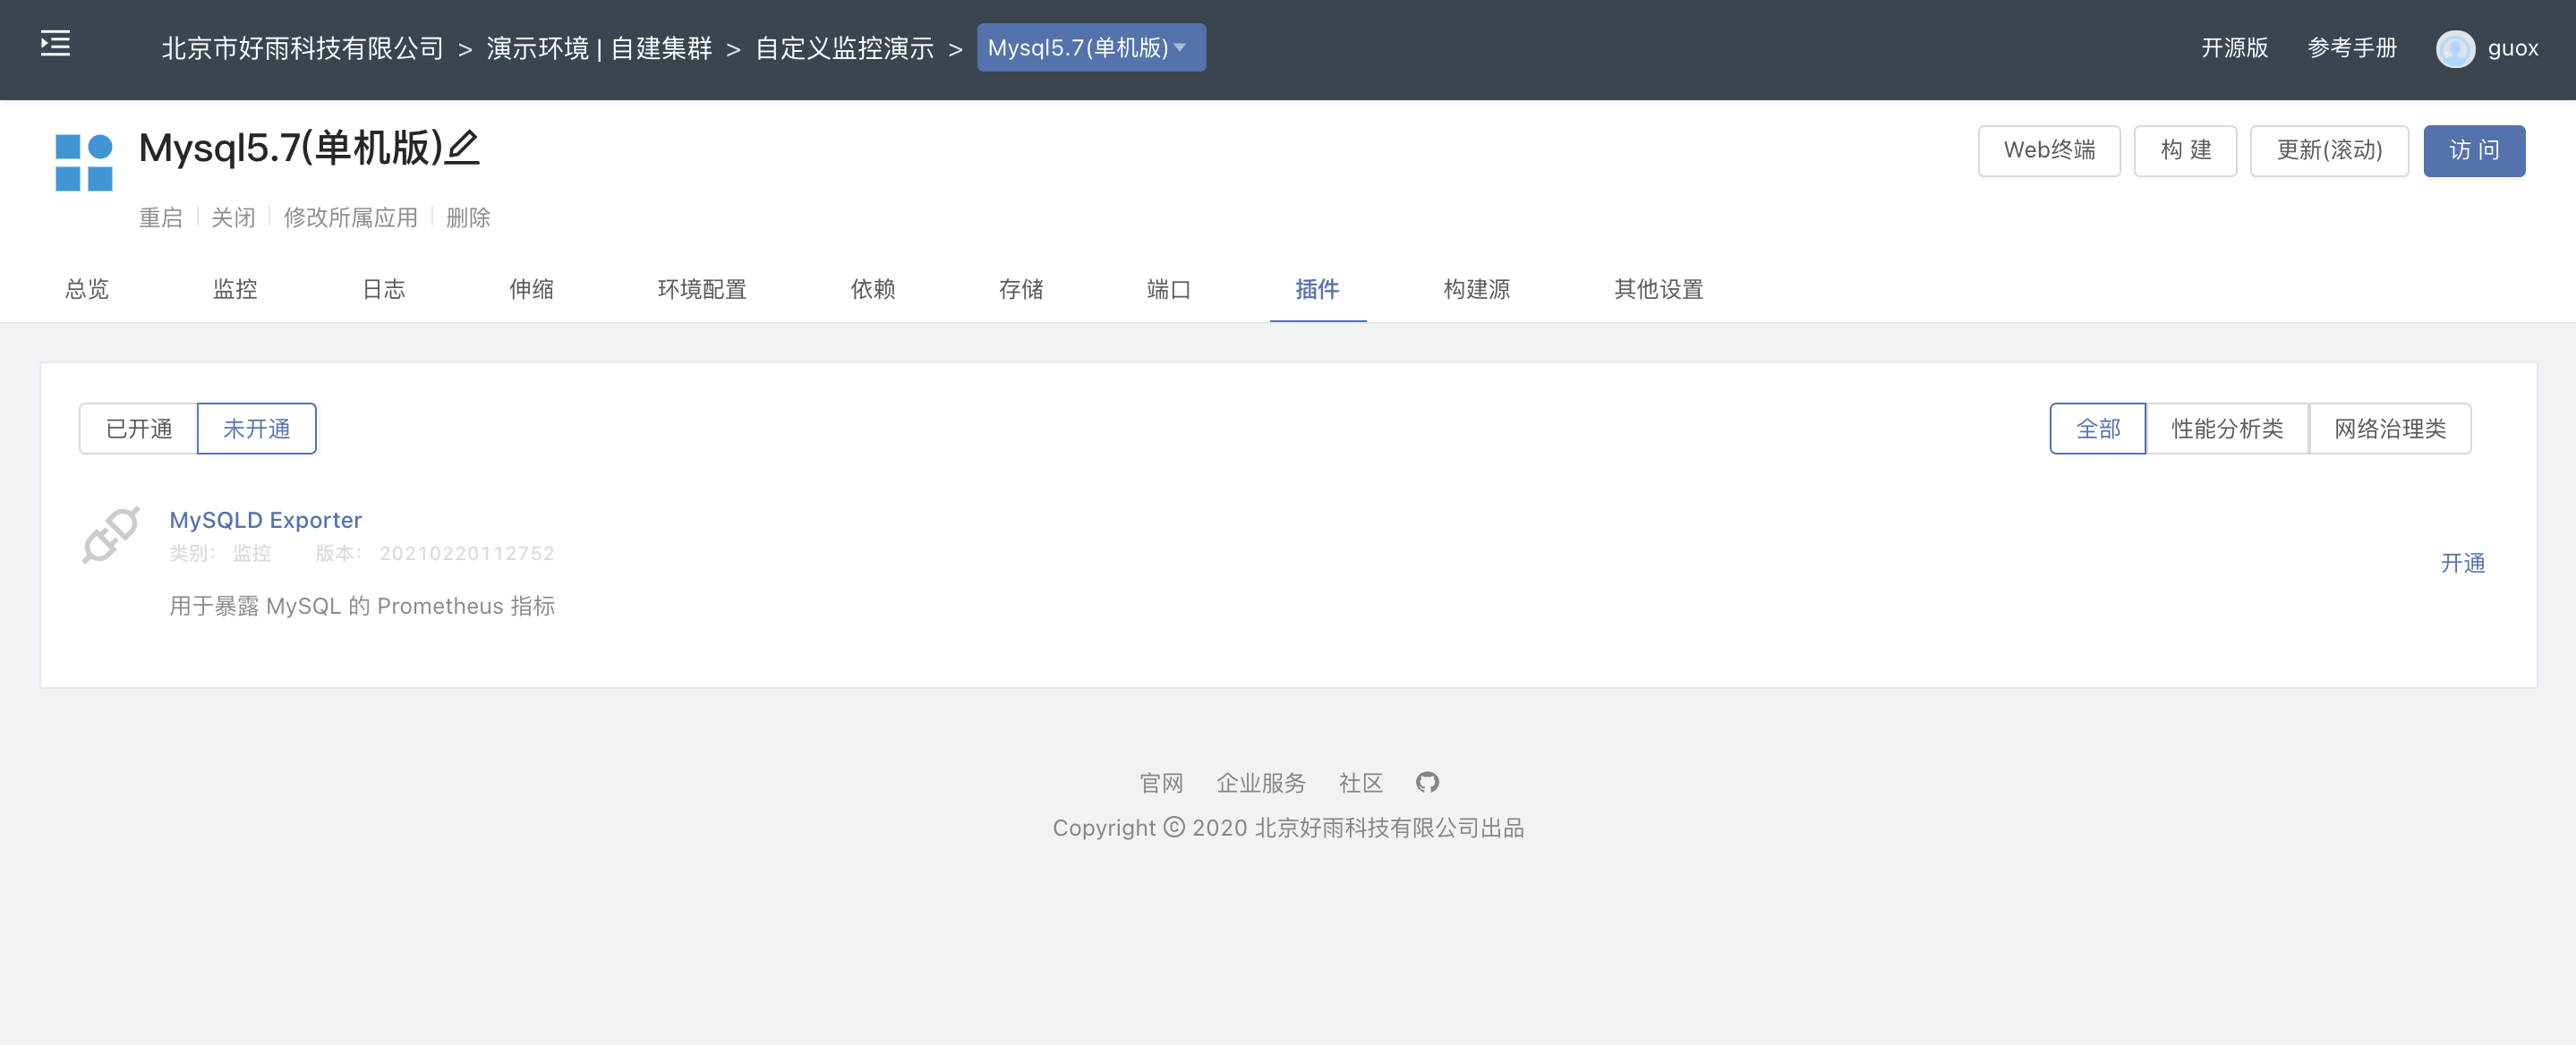
Click the Plug-in tab to activate the MySQLD Exporter plug-in.

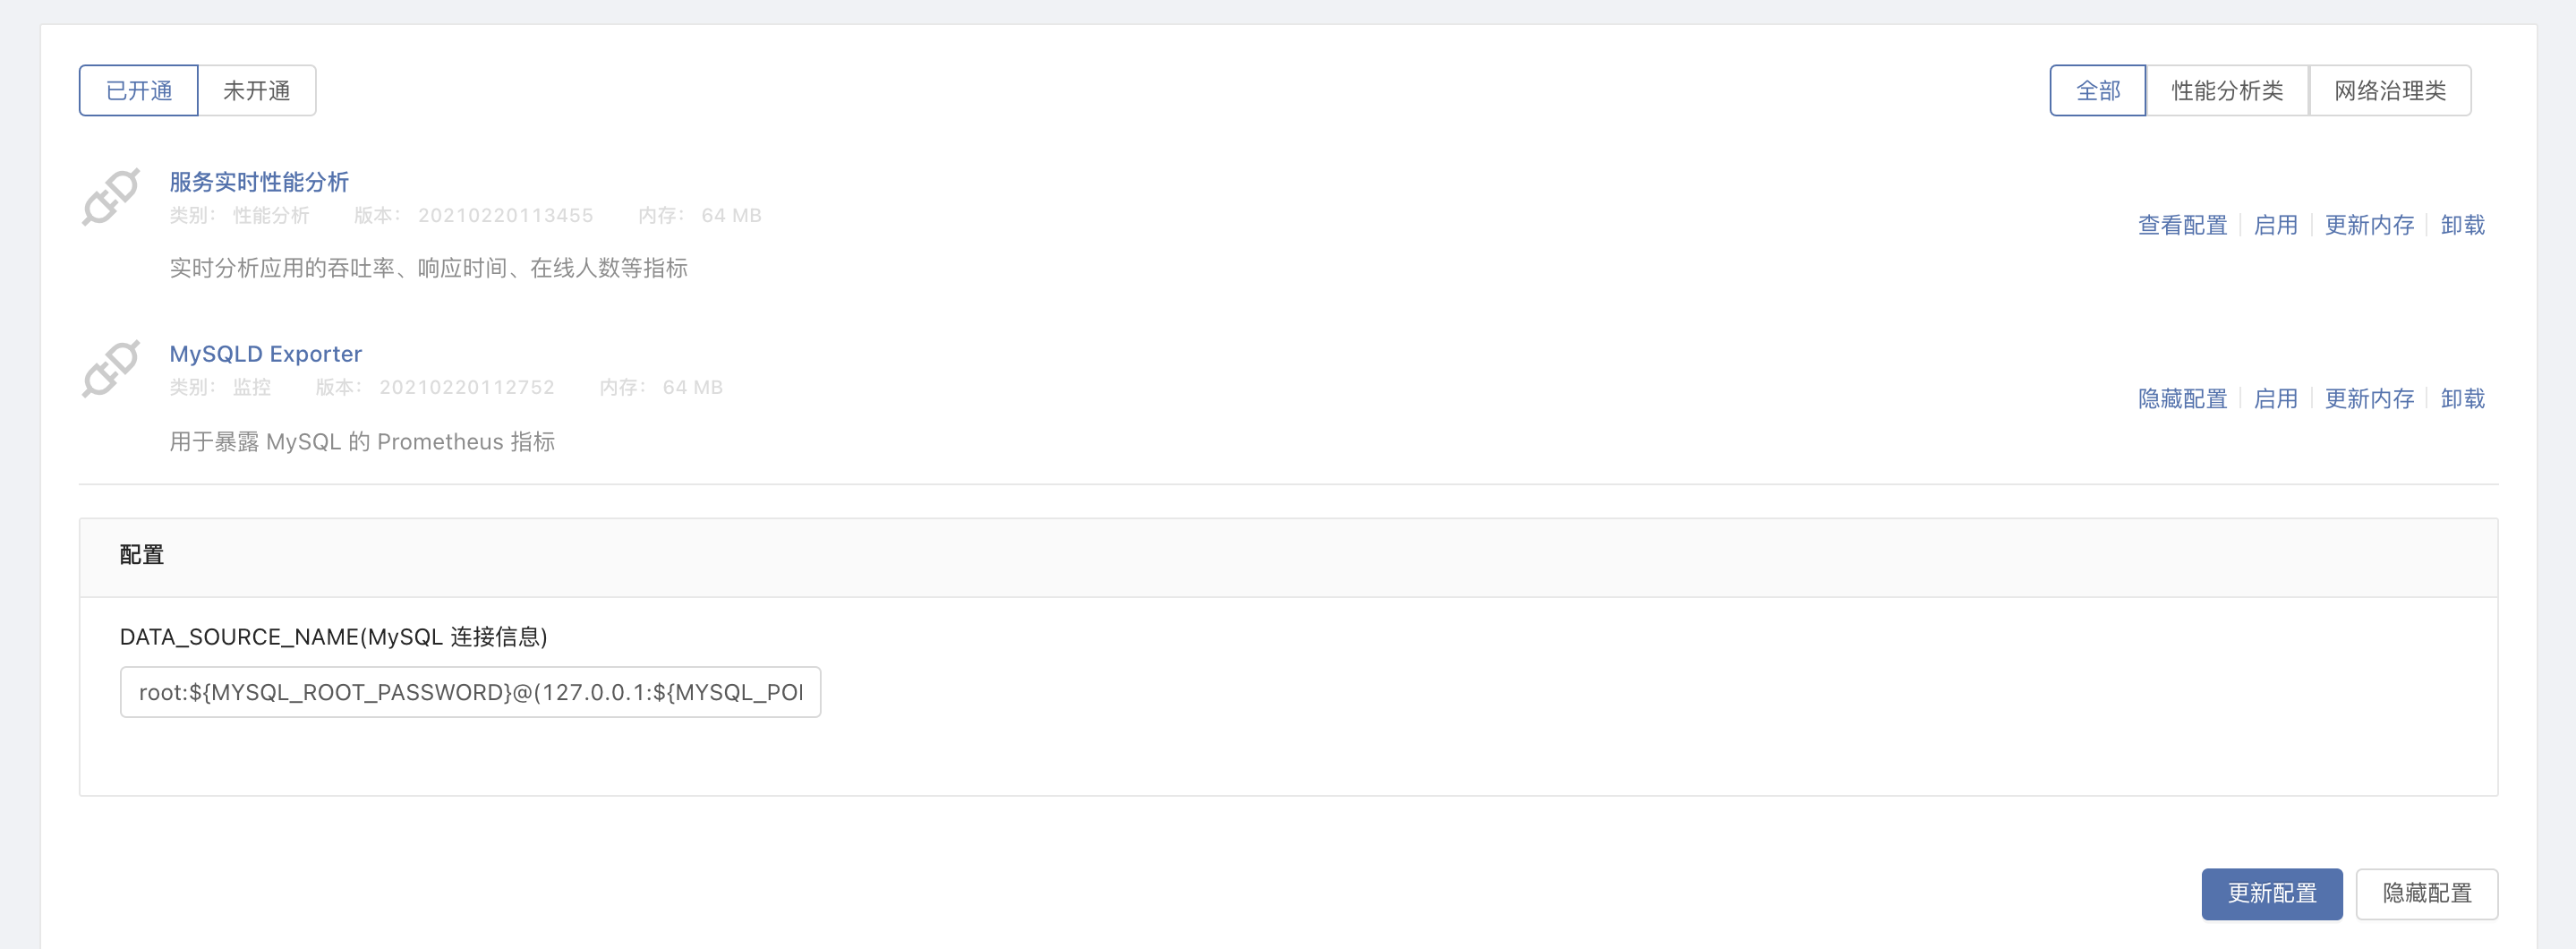
After the plug-in is activated, check the configuration to confirm whether the**(MySQL connection information) is correct.

After confirming that it is correct, update the Mysql service component according to the prompt **, and you can start to collect the indicators provided by MySQLD Exporter.
View monitoring
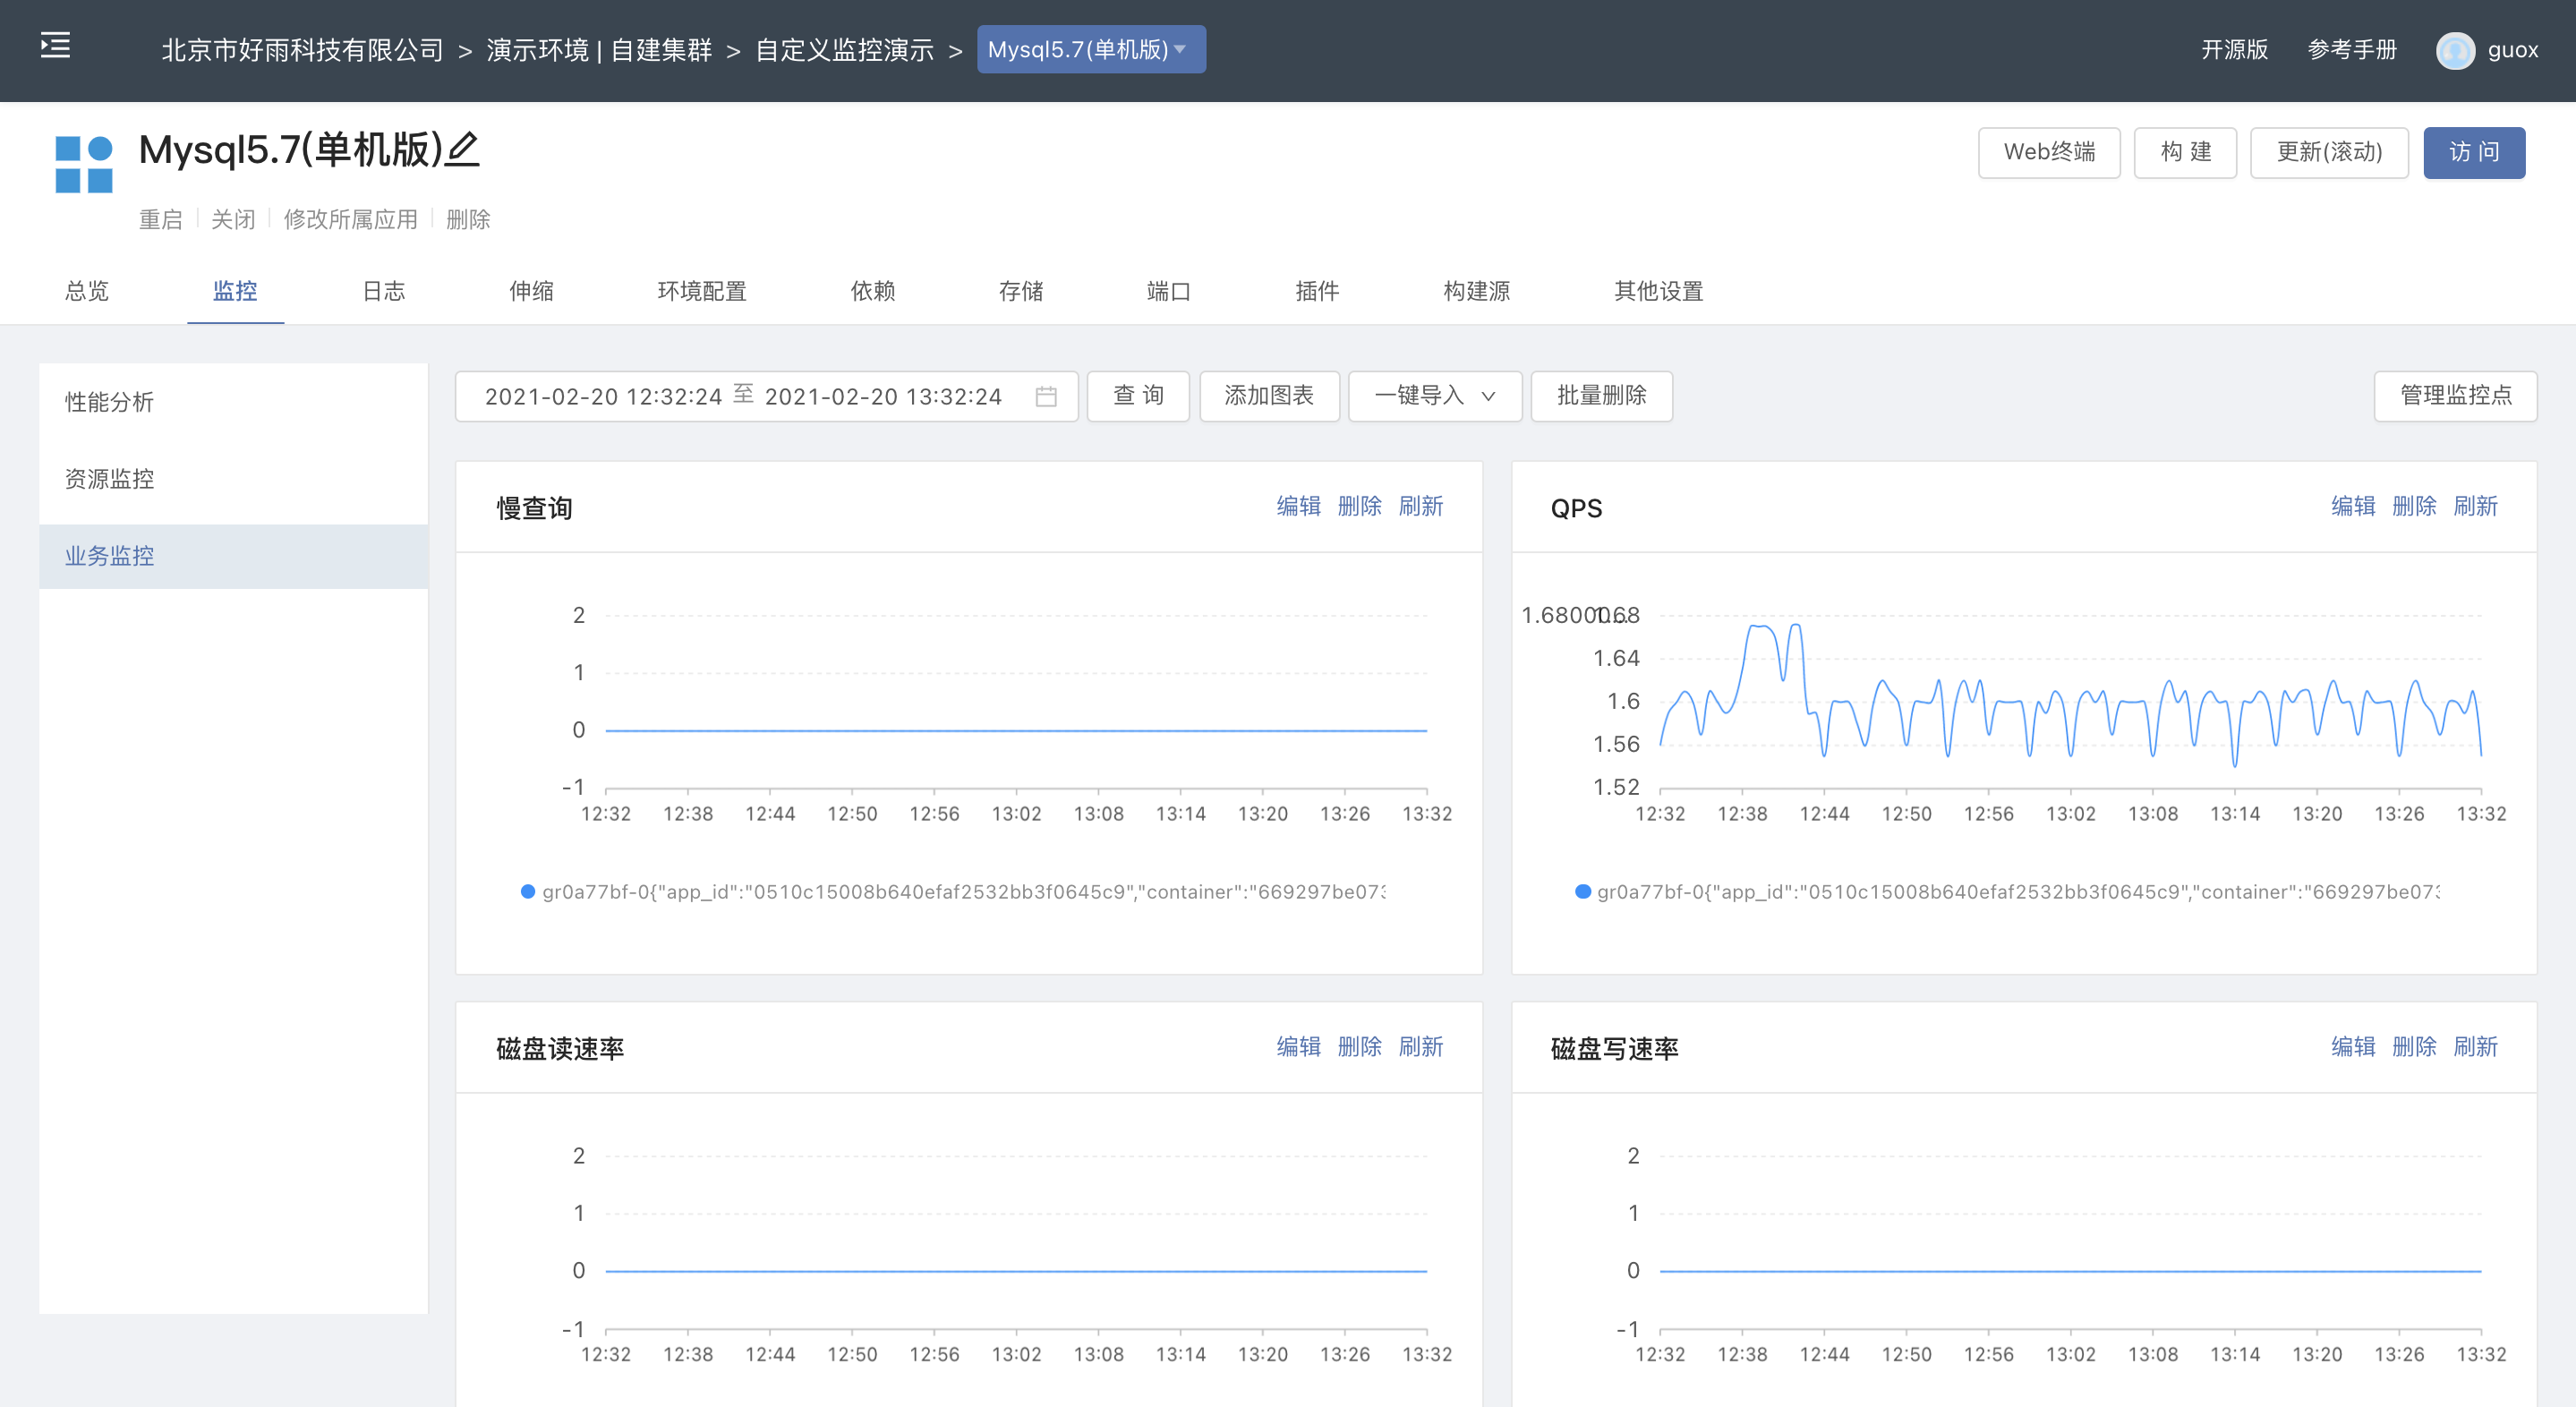
This plug-in has been configured with common monitoring charts by default, and you can view them directly.
Click monitoring - business monitoring in turn to see the corresponding monitoring chart:
 The MySQLD business monitoring data items displayed by the default monitoring chart include:
| Monitoring item |
|---|
| slow query |
| OPS |
| Disk read rate |
| Disk write rate |
| Byte receive rate |
| Byte send rate |
| InnoDB cache pool size |
| connection thread peak |
| running thread peak |
| Average running thread |
| Table Lock lmmediate |
| Table Lock Waited |
Manage monitoring points
By clicking the management monitoring point in the upper right of the business monitoring panel, you can define monitoring point information, which defines the source of monitoring indicators.
The MySQLD Exporter plugin has defined a set of monitoring point configurations. This set of configurations includes the following elements, all of which are required:
Configuration name:Customize the name of this group of configurations
Collect task name:custom
The source path of the path:indicator, according to the exporter design, you need to fill in the appropriate path
port:The port on which the Exporter listens
Collection interval: how often to collect metrics
Multiple groups of configurations can be added to monitoring points, and users need to configure them according to their own designed Exporter.
Add monitoring chart
If we want to add a monitoring chart to show the current number of connections to the database, then please follow the steps below to:
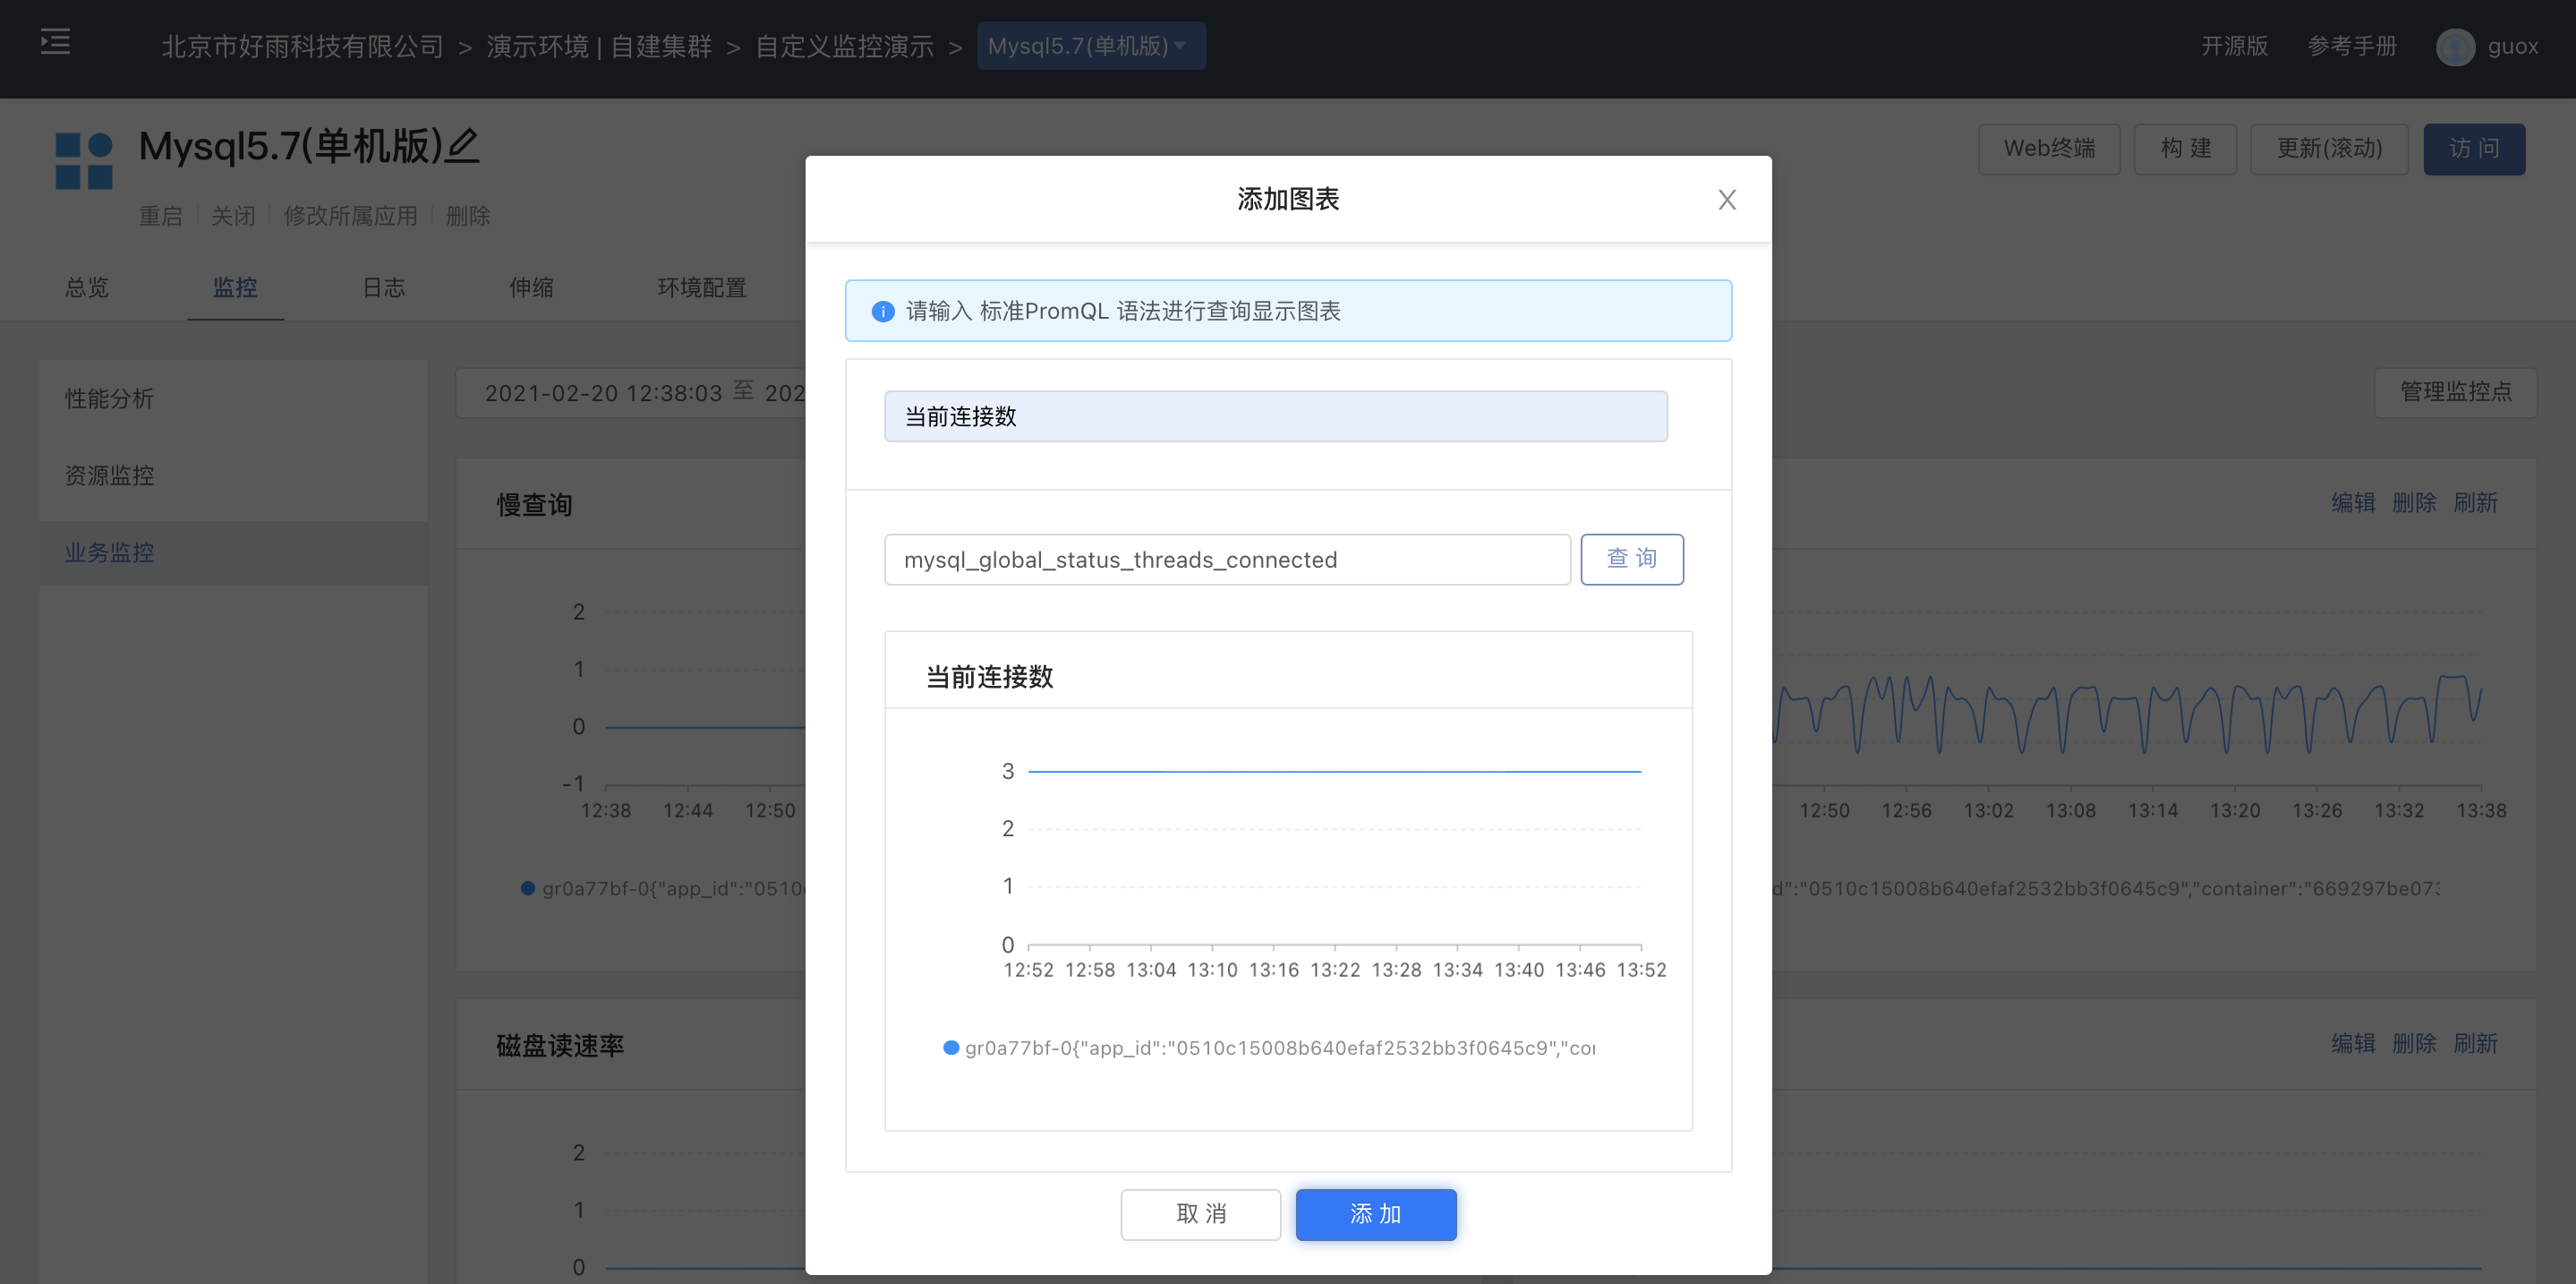
Click above the business monitoring panel to add chart
After entering the new title and the corresponding query condition mysql_global_status_threads_connected , click to query.If the chart is returned normally, the query conditions are correct.The definition of the title should be as clear and concise as possible, and the unit should be specified where necessary.

After clicking to add , the new monitoring chart can be added to the business monitoring panel.The newly added monitoring chart will be placed last.
Access the port 9104 of the Mysql service component, and you can view all the monitoring items available for graphing under the /metrics path.
Custom monitoring for other types of business
For JAVA applications built from source code, we integrate exporter in the construction process, and its usage refers to best practices: Custom monitoring for JAVA applications